
How to Detect Invalid Website Traffic Fast
Дата публикации:
Start With a Baseline, Not a Suspicion
Let’s start with the most important thing: first and foremost, we highly recommend creating an account on our platform — traff.org.
All you need is an email address. You don’t need to pay or link a card to test the platform — just send us a message in the website chat or via messenger, and we’ll grant you a test budget to evaluate the traffic!
And now, moving on to web traffic, let’s get right into the main topic.
Befor labeling any traffic as invalid, establish what normal looks like for your site. Review at least 30 days of data by channel, country, device category, landing page, session duration, pages per session, engagement rate, and conversion rate. For low-volume websites, use a longer period so a single campaign does not define the baseline.
The goal is not to expect identical metrics every day. A search visitor landing on an informational article should behave differently from a returning customer who arrives directly at checkout. What matters is whether a segment breaks the expected relationship between source and behavior.
For example, a paid social campaign may legitimately create short sessions and lower conversion rates than branded search. But if 95% of sessions from one campaign last exactly one second, use the same screen resolution, and arrive in identical bursts every hour, that pattern deserves investigation.
The Fastest Signals of Invalid Traffic
One unusual metric is not proof. A cluster of unusual signals is much more useful. In Google Analytics, Google Analytics 4 exports, server logs, or a BI dashboard, isolate the suspicious source and compare it with your site average and similar campaigns.
Look for these patterns when you need to detect invalid website traffic:
- Extreme engagement values. Near-zero engagement, one-page sessions, and no events may indicate bots, but so can a slow landing page or an irrelevant ad. The stronger signal is repetition at scale.
- Unnatural session timing. Hundreds of visits arriving in evenly spaced intervals, at the exact minute, or in recurring overnight waves often point to automated activity.
- Geographic mismatch. Traffic attributed to a target state or city but paired with language, time zone, ISP, or conversion behavior that does not fit the campaign needs review.
- Device and browser concentration. A large volume from one outdated browser version, a single screen size, or an improbable device mix can indicate automation or proxy-based traffic.
- Landing-page anomalies. Bots frequently hit pages that were never promoted, parameter-heavy URLs, admin paths, or old pages with no current search visibility.
- No downstream activity. High sessions with no scrolls, form starts, product views, add-to-cart events, or other meaningful micro-conversions are a warning, especially on pages built for action.
Do not treat a high bounce rate as a verdict. A visitor can find a phone number, price, or answer immediately and leave satisfied. Instead, connect the session to page purpose. A one-page visit to a local service page may be normal. A thousand identical one-page visits from an unknown referral source are not.
Check Source Data Before You Filter
Traffic source labels are only as reliable as your tagging and referral settings. First, confirm that UTM parameters follow a consistent naming convention. Mixed values such as Facebook, facebook, fb, and blank campaign names split reporting and can make ordinary traffic look suspicious.
Next, inspect referral domains. Referral spam often appears as a source with a strange domain, very high engagement, and no corresponding activity in server logs. Some referral spam is generated at the measurement layer, meaning analytics records an event even though no browser loaded your site. If the session is absent from server or CDN logs, blocking the domain at the website level will not solve the reporting issue. It must be excluded or filtered in the analytics environment.
Also check for self-referrals and payment-provider referrals. These usually indicate cross-domain tracking or referral-exclusion configuration problems, not invalid visitors. Fixing attribution is more valuable than deleting the data because the sessions may represent real customers returning from a checkout flow.
Validate Suspicious Segments With Three Data Layers
Analytics shows the business view, but it should not be your only evidence. Validate major anomalies across three layers: web analytics, server or CDN logs, and conversion systems.
In analytics, create a segment for the suspected source, date range, country, device, and landing page. Review event sequences rather than only aggregate metrics. Real visitors usually produce some variation: different pages, scroll depth, clicks, or time between actions. Automated sessions often repeat a narrow sequence.
In server or CDN logs, review request rate, IP ranges, user agents, response codes, requested URLs, and cache behavior. A high volume of requests to robots.txt, XML sitemaps, login endpoints, or a single product page can expose crawler activity. Repeated user agents are useful clues, but never rely on them alone. Sophisticated automation can imitate common browsers.
[ Web Analytics ] ──► [ Server / CDN Logs ] ──► [ CRM & Conversion Data ]
Finally, compare the segment with CRM, ecommerce, form, or call-tracking data. If analytics reports 10,000 sessions but the segment produces no form starts, no qualified calls, no cart events, and no assisted conversions, it may be low quality or invalid. The distinction matters. Low-intent human traffic should inform targeting decisions. Invalid traffic should be removed from performance evaluation and, when possible, prevented from reaching the site.
Use Controlled Tests for Paid and Purchased Visits
When launching a new traffic source, do not start with a large volume. Use a limited test with a distinct campaign name, a dedicated landing page where practical, and clearly defined expected behavior. Decide in advance which indicators you will measure: target geography, device distribution, source attribution, page depth, session duration, engagement events, and conversion assists.
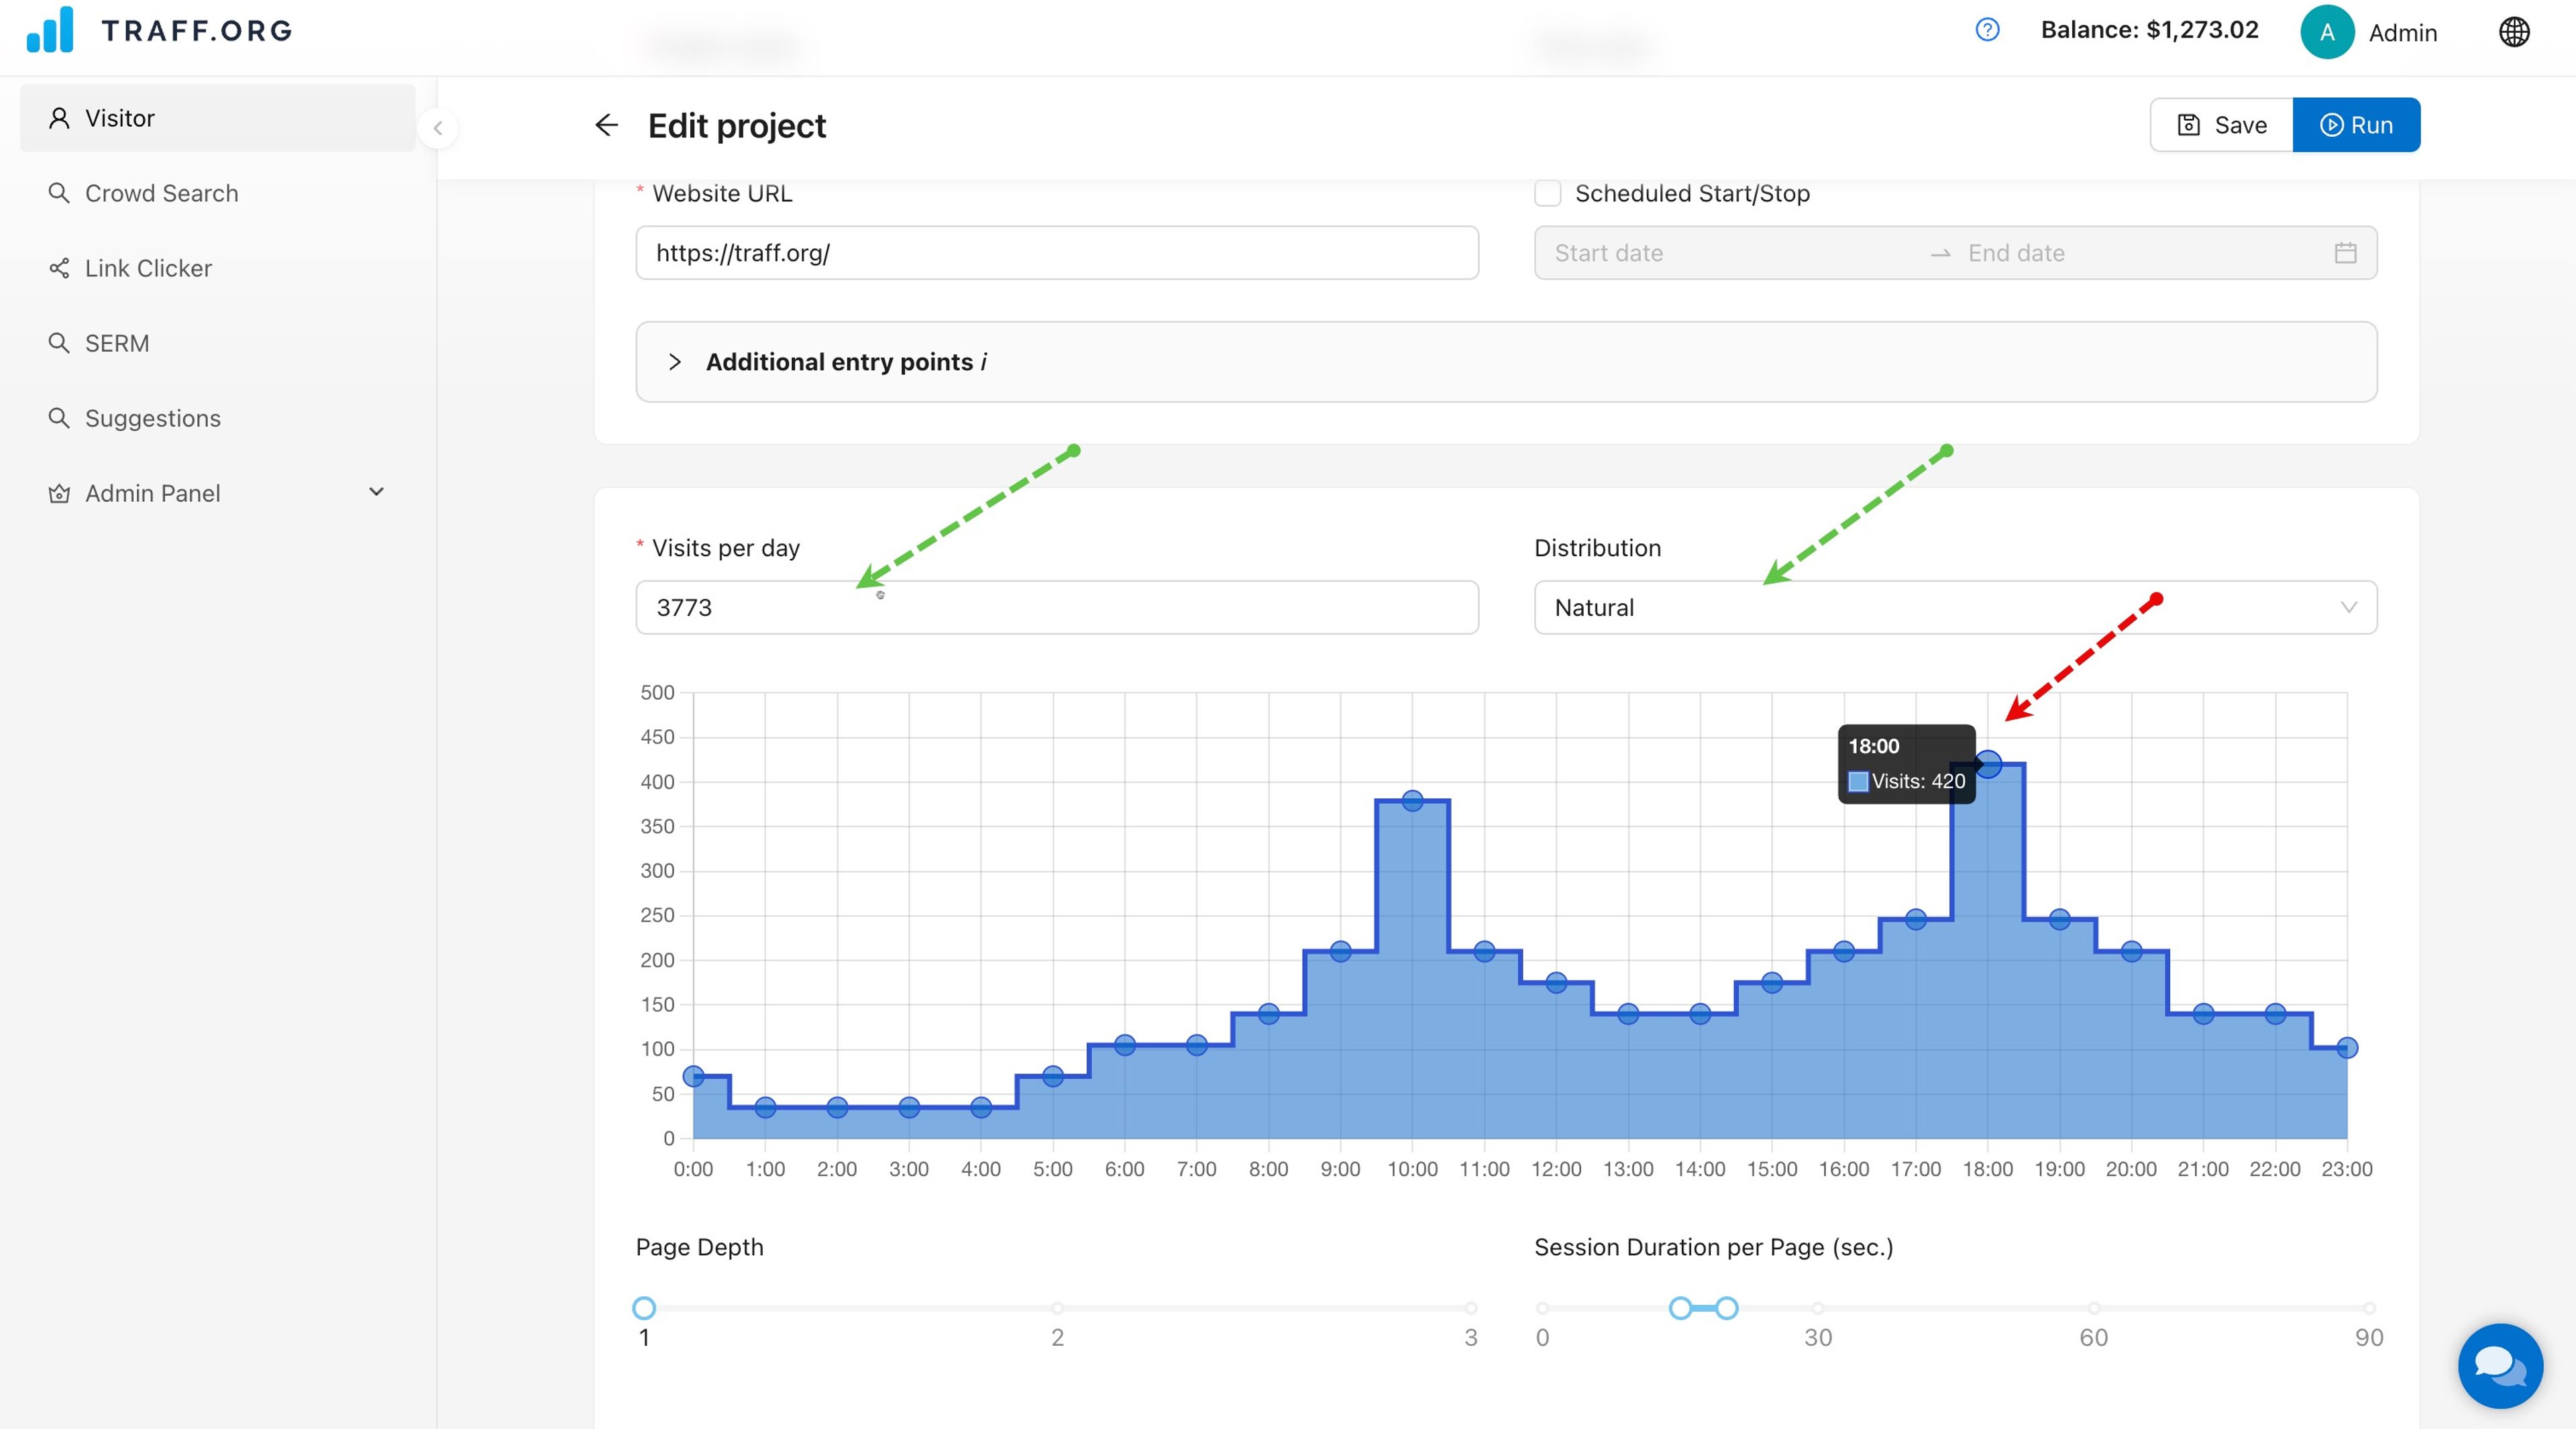
A controlled test makes anomalies visible quickly. If you order 500 visits intended for mobile users in Texas between 9 a.m. and 6 p.m. Central Time, your reporting should broadly reflect those settings. It will not be perfectly uniform, because real traffic varies, but the distribution should be explainable.
This is also why configurable traffic matters. A platform such as Traff.org lets teams set source, region, device, schedule, page depth, session duration, and bounce-rate parameters, then verify the delivered visits in analytics. That level of specification gives you a benchmark for reviewing whether delivery matches the campaign setup.
Block Carefully and Preserve Evidence
The fastest response is often to block suspicious IPs, user agents, or countries. That can reduce server load, but it can also block legitimate users behind shared corporate networks, mobile carriers, or privacy tools. Start with narrow controls when the evidence is clear, then measure the result.
For repeat bot activity, use a web application firewall, rate limits, challenge pages, and rules for abusive paths. Protect forms with validation, honeypot fields, and submission-rate controls. For analytics-only spam, apply reporting filters or exclusions without assuming the website itself was accessed.
Document every action: the affected source, dates, volume, evidence, rule applied, and change in traffic afterward. This protects reporting continuity and prevents the same source from being investigated repeatedly by different team members.
Build an Ongoing Traffic Quality Check
Traffic quality should be reviewed before weekly budget decisions, not only after a dramatic spike. A practical routine is to monitor channel-level volume and engagement daily, inspect new referrers weekly, and audit major campaign segments after launch. Set alerts for sudden shifts in sessions, engagement rate, conversion rate, request volume, or traffic from unexpected countries.
Keep a short list of approved sources, expected landing pages, target geographies, and acceptable metric ranges for every active campaign. This turns a vague question - “Is this traffic real?” - into a controlled comparison against the delivery conditions you set.
Good traffic decisions come from evidence, not from a single dashboard number. When source data, on-site behavior, and conversion records tell the same story, you can scale with confidence. When they do not, pause the segment, isolate the cause, and let the data earn the next dollar of spend.
author: Piotr Novak